Frontend
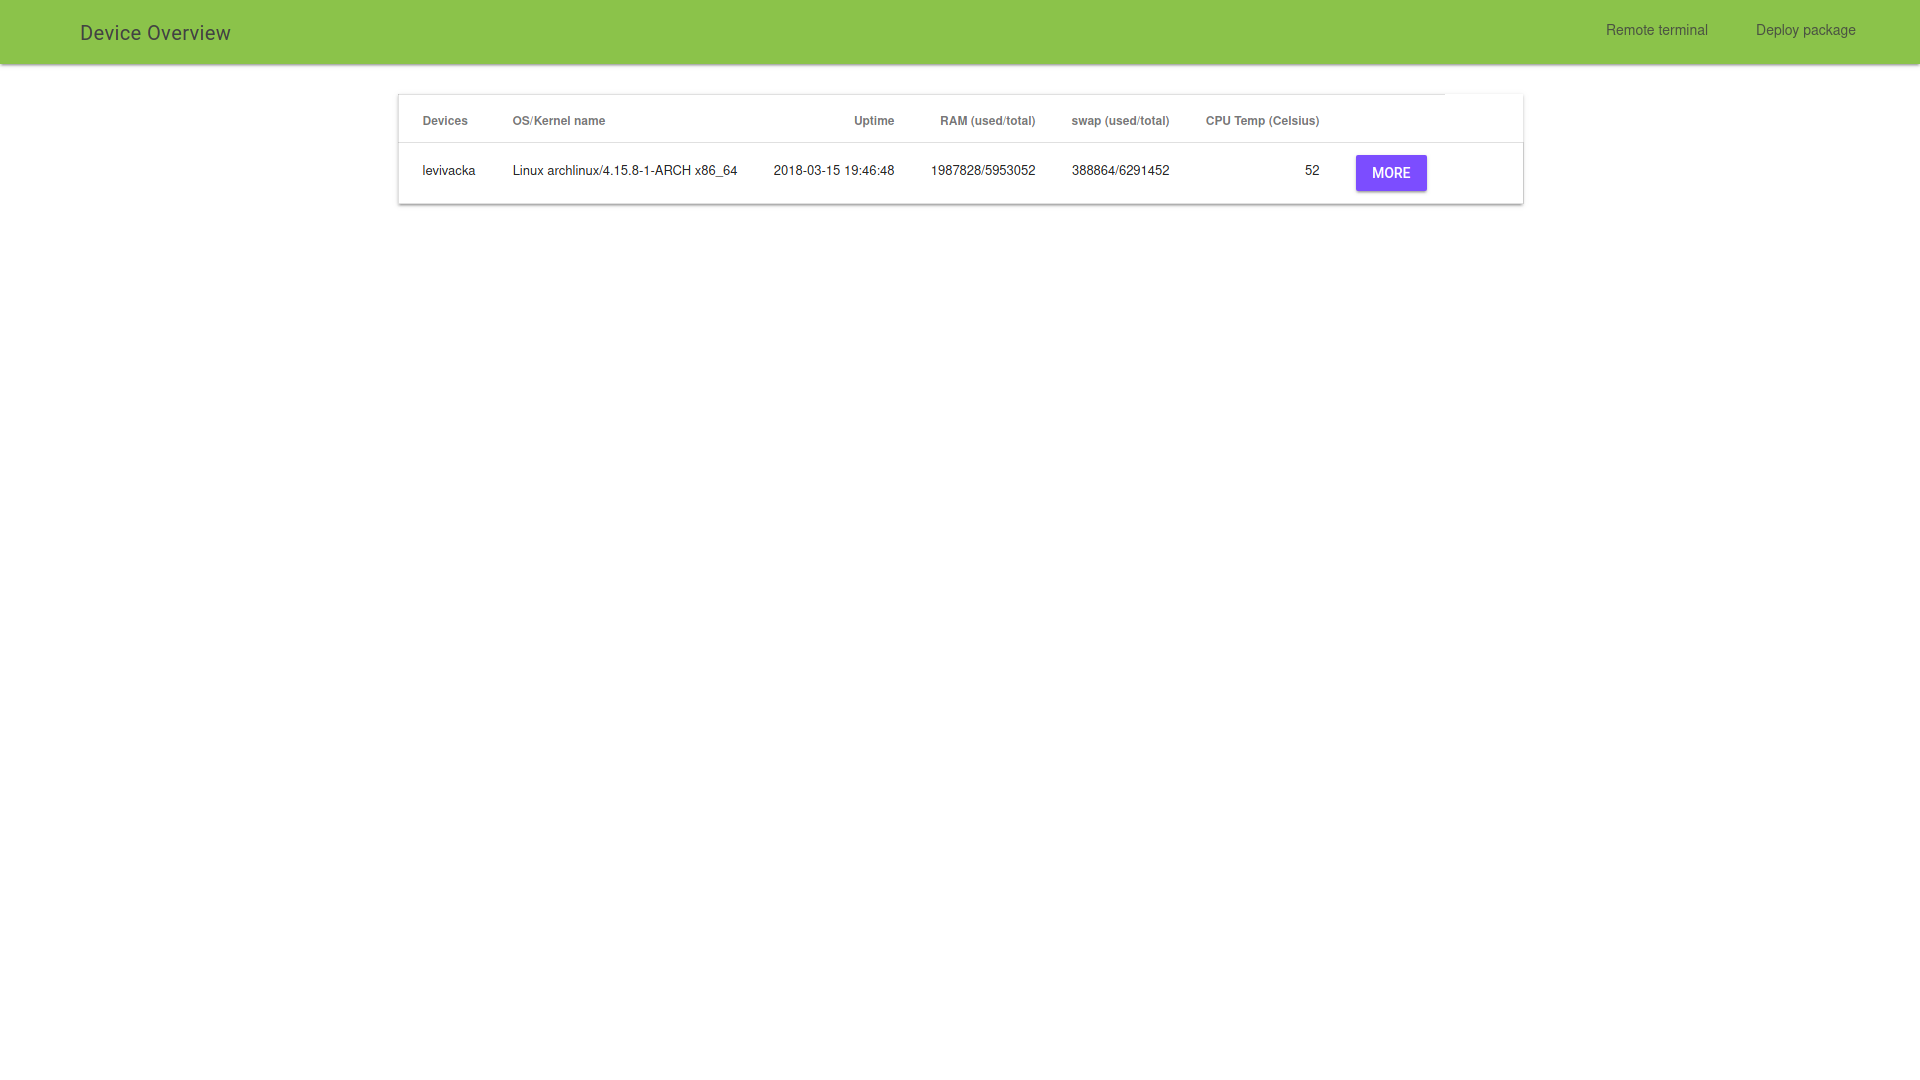
The aim of this part was to create a simple, real-time overview of the devices' status that are part of the current system. The Dashboard includes two main pages:
- a list-like overview of all devices in the system with some of their significant health data
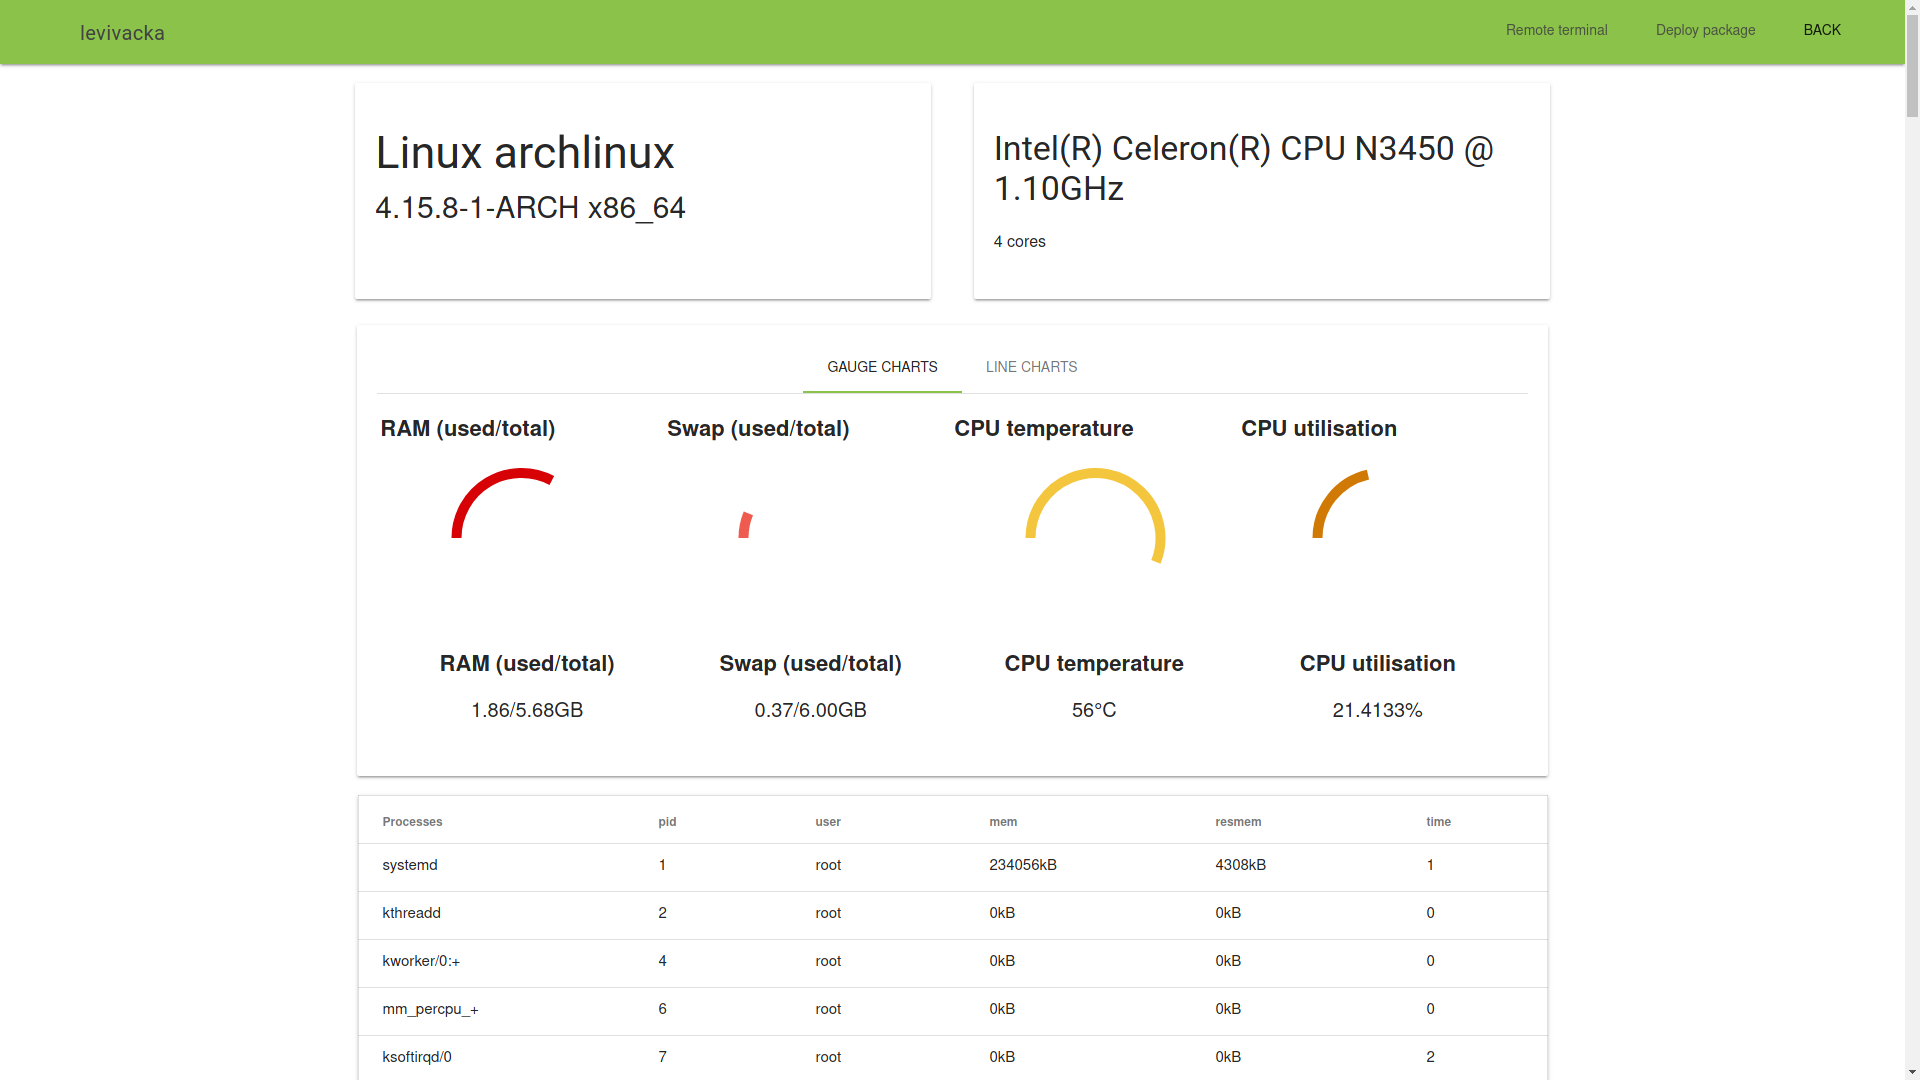
- and a page dedicated to per device overview with
- OS and Kernel information
- CPU, RAM and Swap data (with visualization)
- and a list of running processes.
- access to server and remote terminals and a specific pop-up to deploy packages
Design
We used Material Design Lite, as it relies only on html, CSS and vanilla javascript, works easily across most of the popular browsers and devices and is open-source (Apache License 2.0).
Charts
Charts are only used per device to offer a cleaner end result.
The gauge charts (by Chartist) give the user a graphical representation about the current status of the device, while the linechart (by Chartjs) provides a more detailed look on the changes of this status with time.